Distributed Tracing for Multi-Step Agent Workflows
Traces show you which step in a multi-agent workflow actually broke.
A customer-refund agent worked fine in staging, but once it reached production, it started approving refunds for orders that did not exist. The agent's own logs showed only the initial input and the final output, so anyone reviewing the record afterward could not see either failure. This piece covers distributed tracing as the discipline that lets a multi-step agent workflow be debugged the way it actually fails, not the way a single-function program fails.
The refund-agent case is the normal shape of failure in a system built from several independent steps, each with its own way of breaking. Something has to watch the tool calls and the retrieval results independently of the agent's self-narration, because the agent's internal account of what happened was what broke.
Stacks built on LangGraph, AutoGen, CrewAI, and the OpenAI Agents SDK now routinely wire up topologies like a researcher paired with a writer and a critic, a planner coordinating a set of executors, or a supervisor delegating to subagents. Every one of those arrangements multiplies the number of boundaries where a wrong handoff, a silently dropped context field, or a misrouted result can hide. Once an agent system looks like a small distributed system instead of a single function call, it has to be diagnosed with the tools distributed systems engineers have used for years, not with print statements and a hope that the final output looks plausible.
How distributed tracing recovers the causal chain agents lose
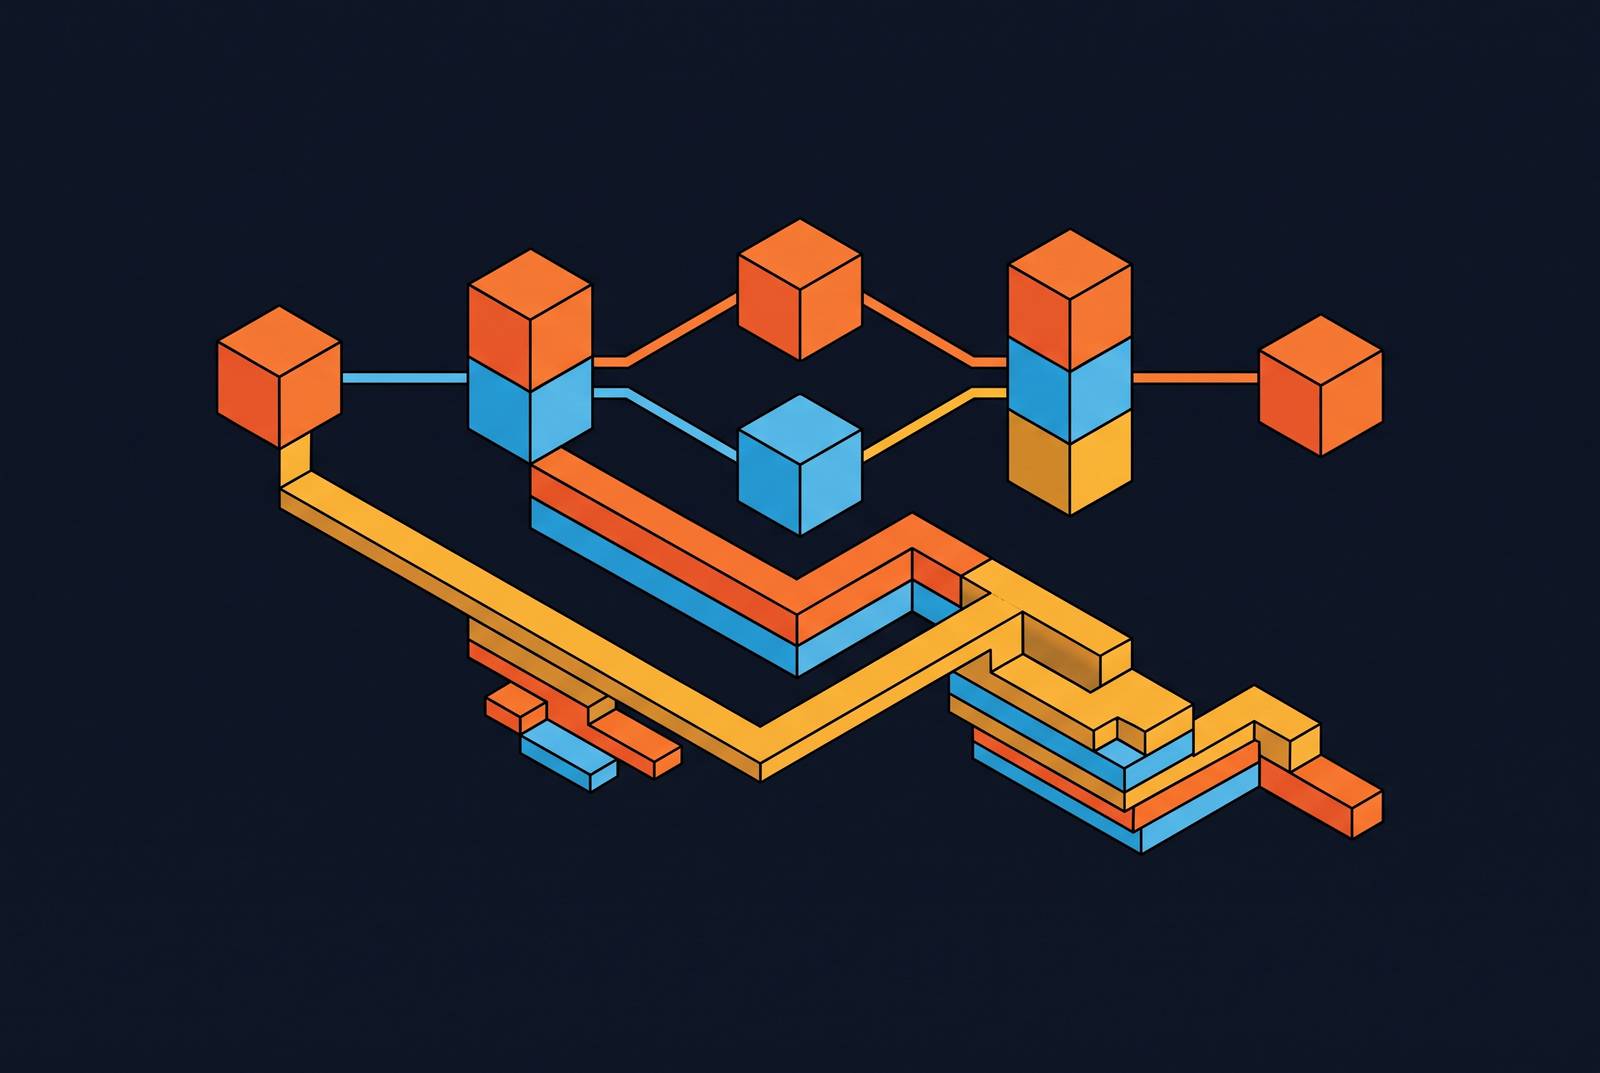
Distributed tracing solves this by forcing structure onto what would otherwise be a flat sequence of events. Every agent run gets a trace ID. Every step inside that run, whether it's a model call, a tool invocation, or a retrieval, gets its own span. Spans carry parent-child relationships to each other, along with timestamps, durations, and whatever attribute metadata the team decides to attach. Instead of a log file to scroll through, you get a tree that can be replayed, showing which span kicked off which, how long each took, and where the chain of cause and effect actually broke.
That tree is what turns a vague complaint ("the agent gave a wrong answer") into a specific diagnosis. A log can tell you that an error happened somewhere in a run. A trace can show that the retrieval span returned the wrong documents, that those documents fed a prompt template that built bad context, and that the bad context is what led the model to hallucinate. One of those is a symptom report. The other is a chain of causation a person can act on without guessing.
None of this is a novel idea borrowed loosely from somewhere else. SRE teams have run exactly this discipline against microservices since distributed tracing was formalized for large-scale service meshes, and the same span-and-trace primitive that autonomous SRE agents now use to triage production incidents is the one multi-step agent workflows need applied to themselves. Trace, span, parent-child, session: those four terms carry the rest of the argument.
OpenTelemetry as the interoperability backbone for agent traces
OpenTelemetry has become the common layer, so you can move agent traces between tools, teams, and vendors without each one inventing its own format. Its distributed tracing model maps onto agent structure with very little translation: each step in an agent's run becomes a span, parent-child links capture who called whom, and the full trace tells the story of how a single request moved through the system. That fit is why a standardized tracing format, rather than a bespoke one, has become the default choice for teams building agent observability in 2026.
Anthropic has added OpenTelemetry support for Claude Cowork activity on its Team and Enterprise plans, and the Claude Code monitoring docs now spell out concrete fields for the claude_code.llm_request span: gen_ai.system, gen_ai.request.model, request_id, input_tokens, output_tokens, success, and error. In OpenTelemetry semantic conventions v1.42.0, released June 12, 2026, every gen_ai.* attribute, metric, event, and span was deprecated in the main semantic-conventions repository and moved into a dedicated semantic-conventions-genai repository. Teams that bookmarked the old gen-ai documentation page will find a "Moved" notice there instead of a redirect: the page still returns a normal response, it just tells you the content lives somewhere else now.
Two more changes landed in v1.41.0, released April 28, 2026, and if you build dashboards around these spans, both matter to you. MCP tool tracing, added back in v1.39, propagates trace context between an agent and the MCP server it's calling, so those calls join one trace instead of splitting into two disconnected ones.
None of this should be mistaken for a finished standard. The GenAI and MCP semantic conventions remain in Development status with no public date for stabilization, and attribute names can still move under a team's feet. The sound approach is to pin the specific version of the conventions a system emits, and to treat the schema as infrastructure still under construction rather than a contract that will hold still.
Instrumentation needed at each layer of an agent run
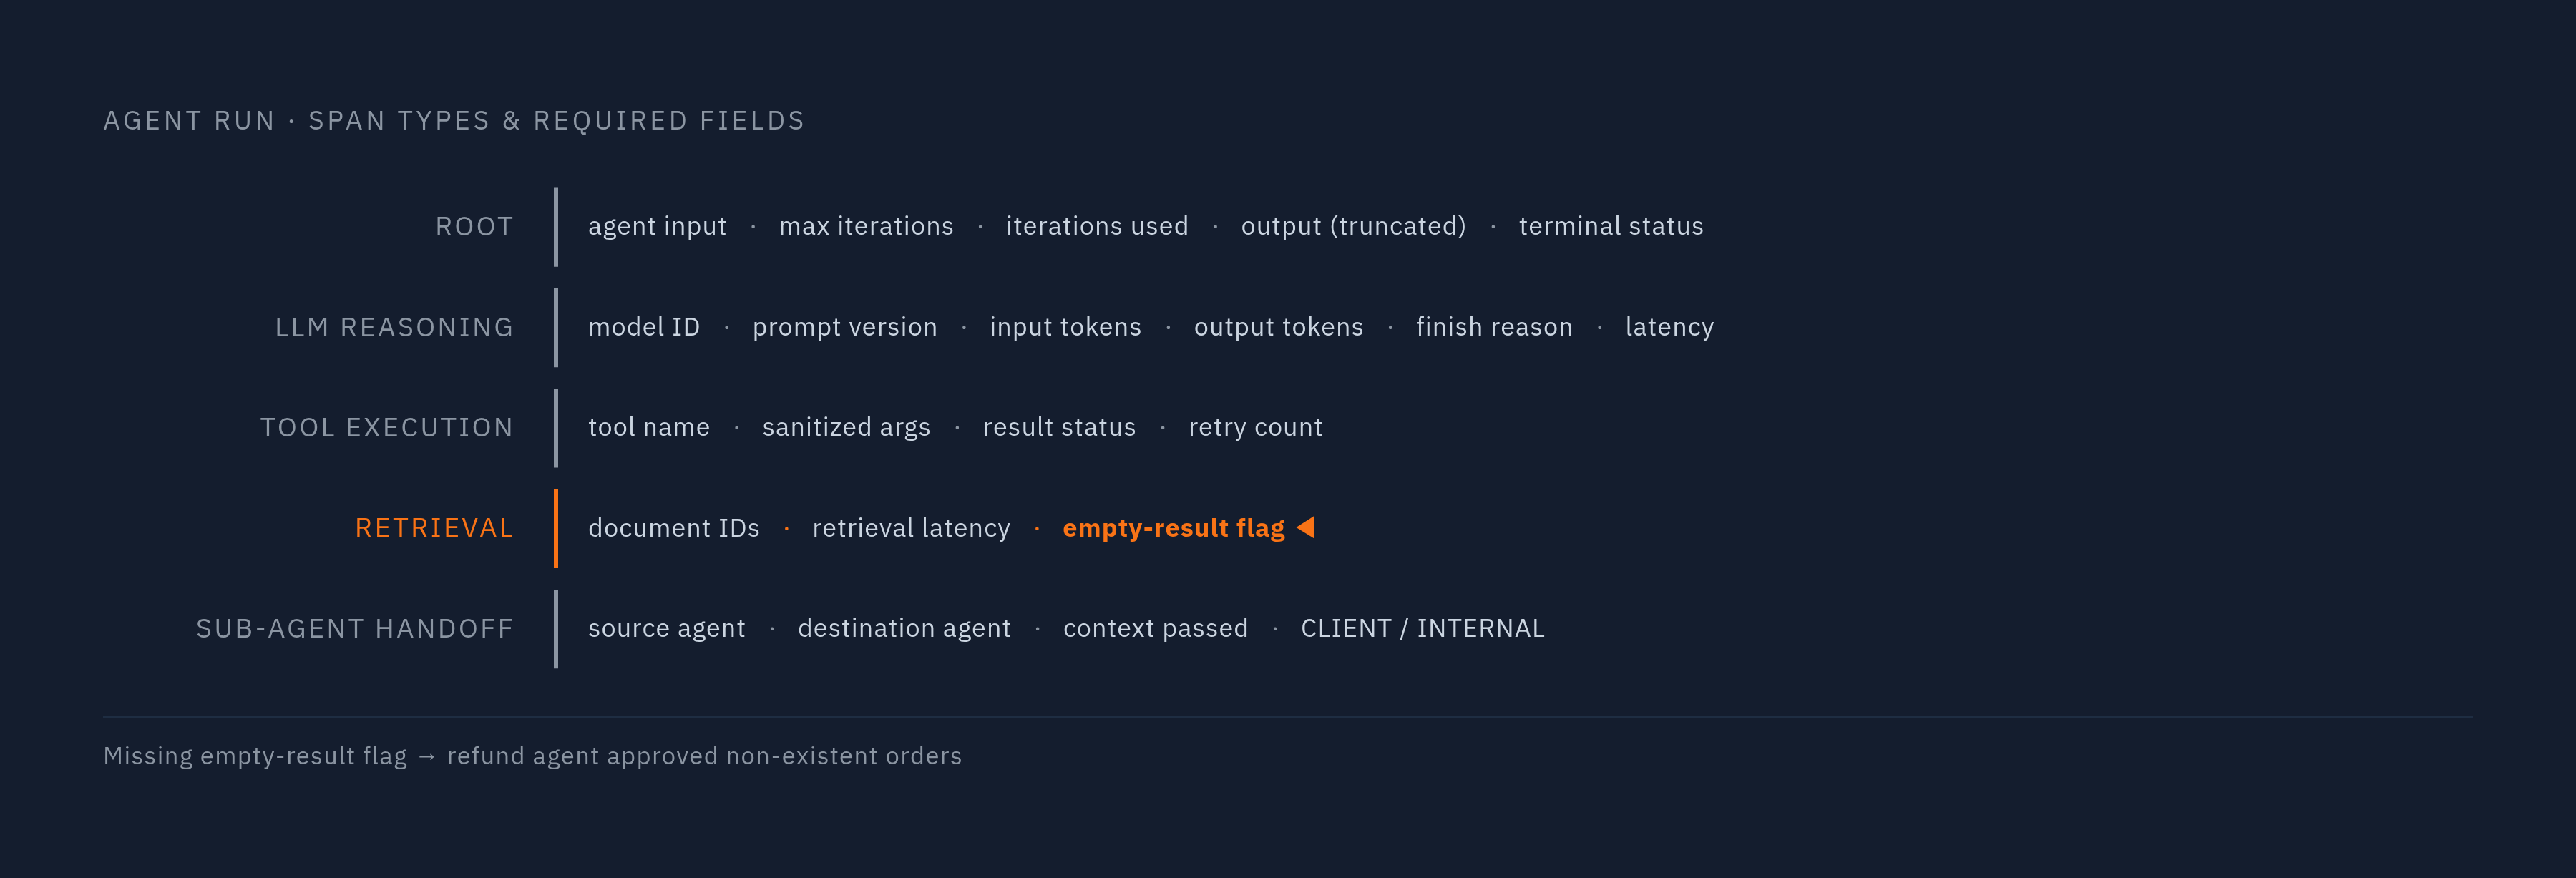
A trace is only as useful as the fields attached to each span, and different span types need different minimum data to be debuggable. The root span, covering the full agent execution, should carry the agent's input, the maximum number of iterations it was allowed, the number it actually used, a truncated version of the final output, and a terminal status. LLM reasoning spans need the model ID, the prompt version in use, input and output token counts, the finish reason, and latency, which lines up closely with the fields Claude Code's monitoring documentation now specifies by name. Tool execution spans should carry the tool's name in the span name itself, as the v1.41.0 convention now requires, along with sanitized arguments, the tool's result status, and a retry count, since giving each tool call its own span is what lets a team attribute latency and failure to the specific tool rather than to the agent loop as a whole.
Retrieval spans carry their own quiet danger. They need the IDs of whatever documents were retrieved, the retrieval latency, and a flag for whether the result set came back empty, because an empty result silently interpreted downstream as "no restrictions found" is precisely the failure mode that let the refund agent approve refunds it should have blocked. Sub-agent handoff spans need to record the source agent, the destination agent, and the context passed between them, and the CLIENT/INTERNAL split introduced in v1.41.0 exists so these handoffs don't get confused with ordinary local transitions between nodes in a framework like LangGraph.
Lyft's customer-support agent platform shows what you get once a team goes beyond the bare telemetry fields. Lyft enriches its traces with agent name, user type, intent, and conversation ID, and builds production dashboards on top of that enrichment to track run volume, error rates, latency, token usage, and tool-call success rates. Lyft's example shows that business-meaningful metadata belongs inside the span itself, not in a separate log that someone has to join back to the trace by hand.
How the parent-child span tree makes multi-agent handoffs debuggable
If the trace context is not explicitly carried across the boundary between agents, causality in a multi-agent system does not survive the handoff. If even one link in the chain is missing, the rest of the trace collapses into guesswork about what actually happened. Without a hierarchical trace model tying agents together, a five-agent pipeline gives up only two facts when something goes wrong: the request was slow, and the request cost more than expected. A flat per-call log loses the parent-child relationship between agents entirely, so there is no way to know which agent in the chain caused either problem.
Different people across an organization run into this gap in different ways. Product leads cannot tell whether a failure a user saw came from a planner bug, a tool bug, or a bug in the handoff between the two. All four of these are symptoms of the same missing structure, so they don't need four separate fixes.
Two mistakes account for most of the damage here. The second is conflating inter-agent messages with ordinary tool calls. They are different kinds of span, and treating them as the same thing destroys the handoff metrics a team would otherwise build dashboards around.
Done correctly, the parent-child tree turns a vague alert into a specific finding. A support team that sees a spike in eval failure rates for a particular model-routed traffic cohort can open the worst trace in that cohort and see, directly in the timeline, that the planner agent is handing work to the wrong tool a meaningful share of the time, with the parent-child link between planner and tool visible in the structure itself. Tail errors should be sampled at full rate.
Why completion metrics alone cannot establish production readiness
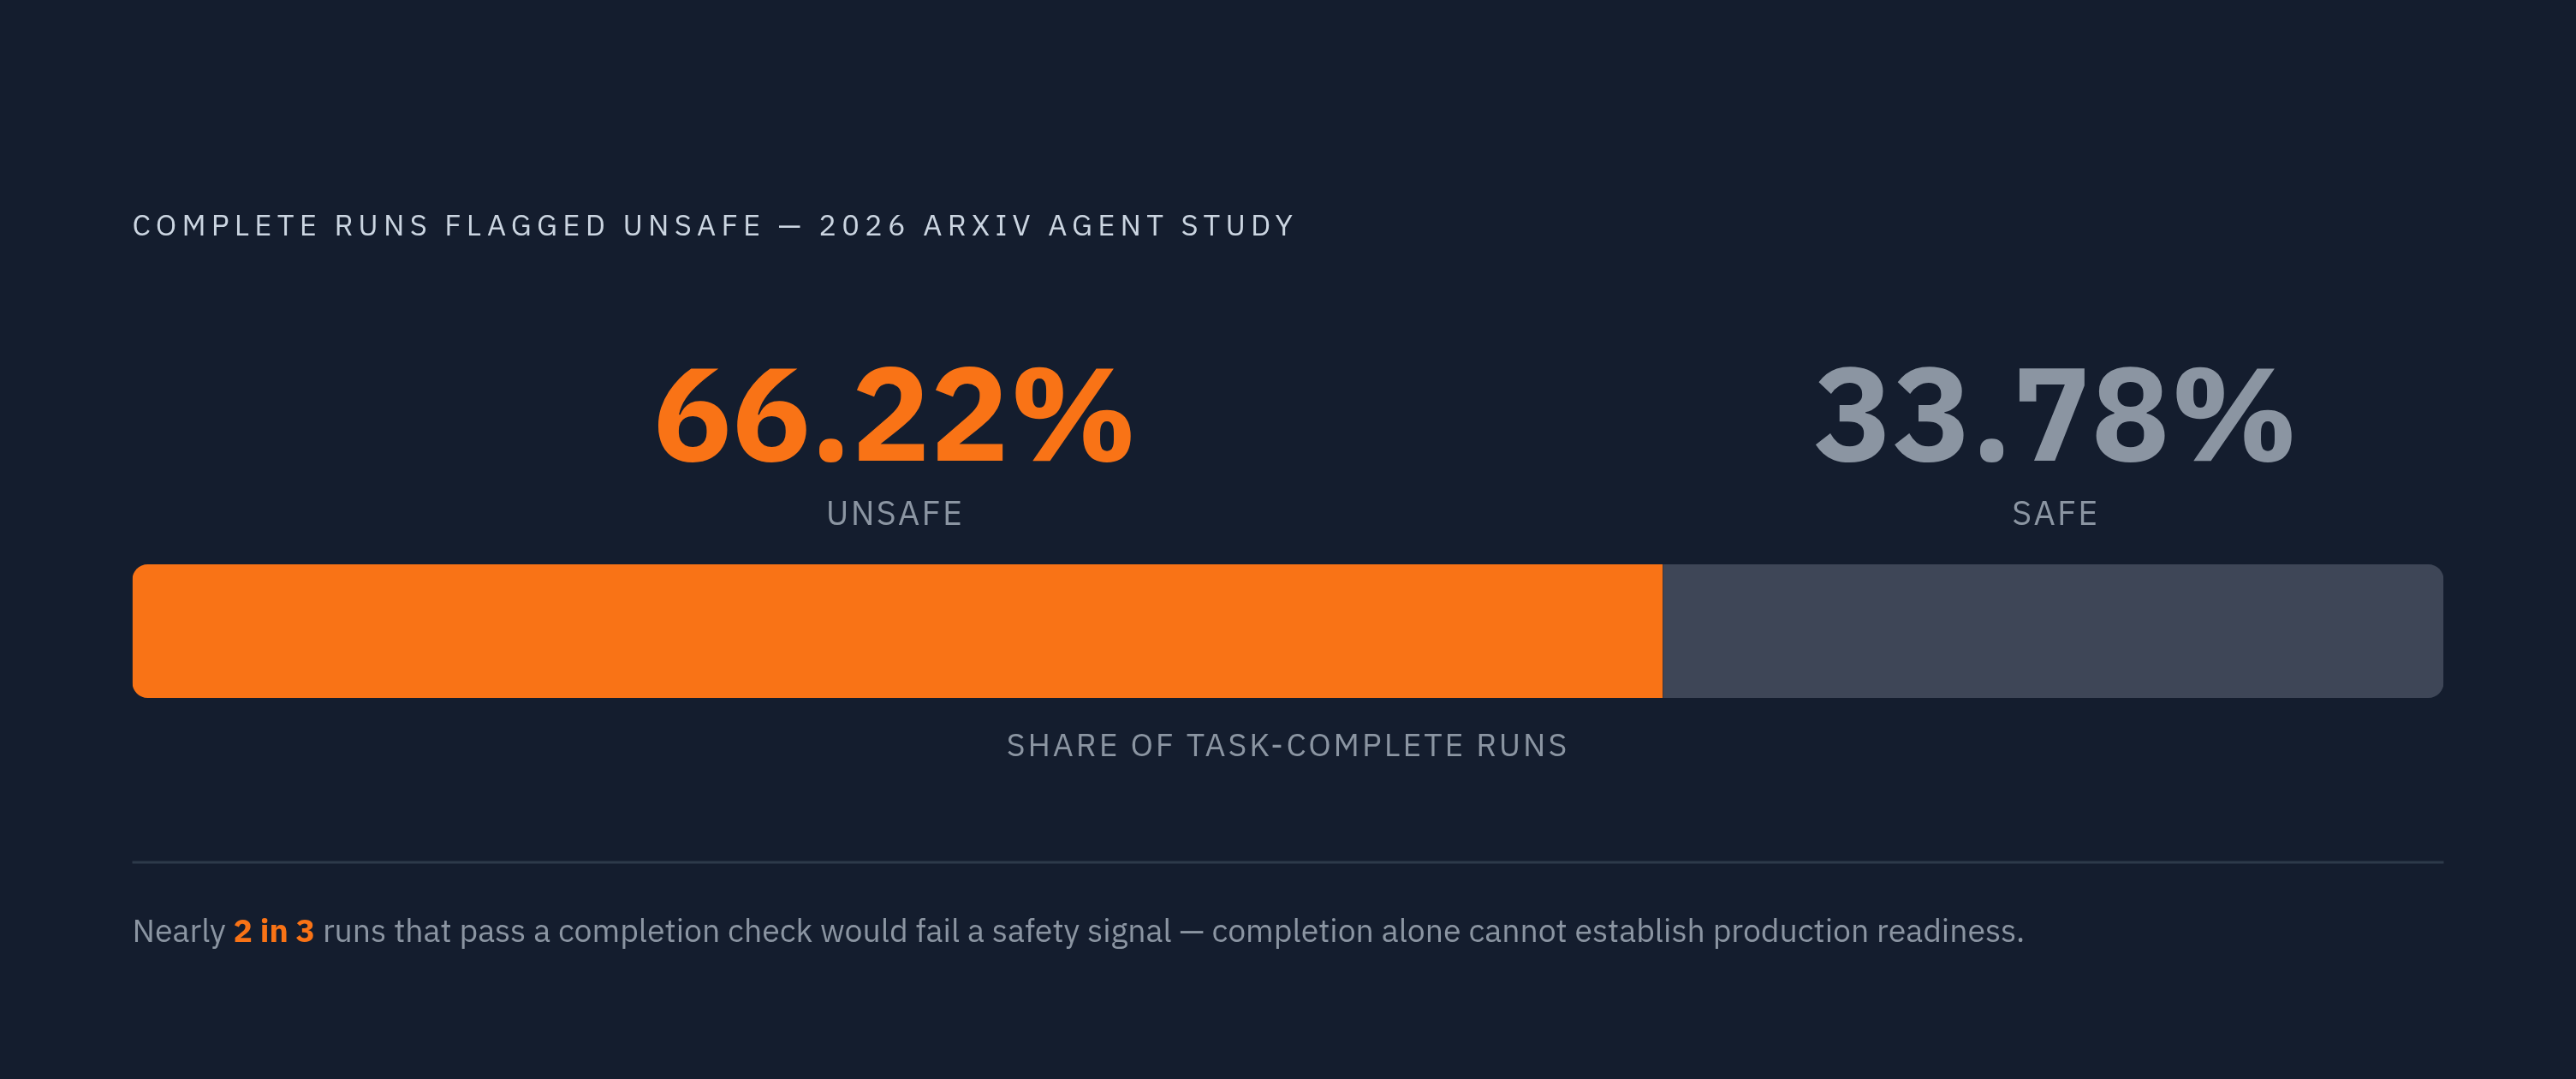
A 2026 arXiv study examined thousands of agent runs and found that 66.22% of them were simultaneously task-complete and unsafe under a pre-specified safety signal. Nearly two-thirds of runs that would pass a simple completion check were, by the study's own safety measure, runs that should not have shipped. That finding sets the boundary of what tracing alone can do. A trace shows what happened: which span ran, what it returned, how long it took, which agent handed off to which. None of that tells a reviewer whether what happened was correct or safe. You need a separate evaluation layer sitting on top of the trace to determine that.
The LangSmith Engine illustrates what that layer looks like in practice. It clusters recurring failures pulled from production traces into prioritized issues, diagnoses root causes by comparing those traces against the underlying code, and proposes prompt or code fixes, and it will even open a GitHub pull request when a repository is connected. The trace is the raw material the evaluator works from; the evaluator itself is a separate layer. Evaluation also needs to happen at more than one level. Trajectory-level evaluation, which scores the full multi-agent trace rather than any single span, catches a specific failure that span-level checks miss entirely: a planner that routes every individual handoff correctly but still steers the team as a whole toward the wrong final outcome. So each handoff can look clean on its own even when the overall trajectory is wrong.
Tracing is a necessary condition for running agents safely in production, but it is not a sufficient one. The evaluator is what closes the loop between what the trace records and whether that record describes a correct, safe outcome.
Trace-based cost attribution as the prerequisite for LLM spend control
The same span data that makes an agent run debuggable is also the only way to control what it costs. Token usage and compute spend can only be managed at the level of individual agents, task types, or users if the tracing layer captures that data per span. Without that attribution, any attempt at cost control amounts to looking at a total bill after the fact and guessing at where it came from.
Input and output token counts belong on every LLM reasoning span, because they are the base data cost attribution runs on, whether a team wants to break spend down by agent, by task type, by user, or by time period. The same span-count signal that flags a retry loop for debugging purposes doubles as an early warning for spend: a sudden spike in span count for one agent is a sign that costs are climbing before the invoice confirms it.
Enforcement has to sit behind these numbers, or the attribution data goes unused. Those limits only function if the tracing layer supplies the per-request attribution they're checked against. Tracing is the prerequisite for LLM FinOps in the most literal sense: prompt caching decisions, provider routing choices, and decisions about when to invoke a large model at all have no measurement surface to optimize against without per-span token counts feeding them.
Governance, compliance, and audit trails as first-class outputs of the trace
Once a trace carries token counts, tool arguments, retrieval results, and handoff context at the span level, it stops functioning only as a debugging aid and starts functioning as a record a compliance team can stand behind. If a compliance reviewer asks which agent emitted a particular piece of regulated content, they need exactly the parent-child structure described earlier in this piece, the same structure an SRE uses to attribute latency to a specific agent in a pipeline. The audit trail and the debugging tool are built from the same data.
That overlap is not incidental. A span that records sanitized tool arguments, a retrieval span that records which documents were pulled and whether the result set was empty, and a handoff span that records what context passed from one agent to another together form a reconstructable account of a decision an agent made. For a regulated team, that reconstructable account lets them answer a regulator's question about a specific decision, instead of having to say the system's internal reasoning was never captured in a form anyone could review afterward. Building that record requires the same discipline covered throughout this piece: a trace ID for every run, a span for every step, explicit parent-child propagation across every agent boundary, and a stable, versioned understanding of what each span is supposed to contain. Treated this way, the trace is the record the system produces simply by running, not an add-on bolted onto a production agent system.