Capturing and Replaying Agent Sessions for Debugging
Capture every step of an AI agent's execution to debug what can't be reproduced on demand.
This article is about why debugging an AI agent requires capturing its full execution record while the session runs, because by the time something goes wrong, the only evidence of what happened may already be gone. Ordinary software debugging rests on a simple guarantee: send the same request twice, and you get the same wrong answer twice. A service with a bug in its pricing logic will miscalculate the same order every time, and that repeatability, reproduction that is free and near-instant, is what makes a bug fixable and is the assumption most debugging tooling was built around.
An agent session breaks that guarantee at the root. State accumulates turn over turn, inside a context window that functions less like a request body and more like a mutable scratchpad shaping every decision that follows it. Tool calls write to real systems outside the agent's own memory: a file gets edited, a ticket gets filed, an email goes out. None of that rewinds when the session ends. The common failure looks like this: a file the agent was never asked to touch has been silently rewritten, the session has already closed, and the only thing left behind is the agent's own account of what it did, which is a reconstruction composed after the fact, not a recording made as it happened.
Running the same prompt again doesn't fix this, either. Temperature settings, retrieval results that shift with the state of a search index, and even which tools happen to be available at that moment can all steer the agent down a different path the second time. Seed two runs with identical instructions and you can still get entirely different tool sequences, so the specific failure a developer is trying to chase may simply not recur on command. That removes the one tool that ordinary debugging depends on most: the ability to make the bug happen again, on demand, in front of you.
What's left is the record of what actually happened the first time. If a session can't be reproduced, it has to have been captured, in enough detail to stand in for the live run itself. That single requirement sets the direction for everything else: a debugging practice built around agents needs to treat the execution trace as the primary artifact, not a backup to reproduction.
What a usable execution record must contain
Capturing "the session" isn't enough on its own; the record has to include both what the agent decided and what it did, because a trace that shows only inputs and outputs leaves the reasoning in between as a black box. A usable record needs the reasoning trace behind each step, the full set of tools the agent considered against the ones it actually invoked, the arguments passed into each call, the outputs those calls returned, any diffs produced along the way, tokens spent per step, and latency per hop, all stitched into a single hierarchical trace that preserves the order events happened in.
Cost deserves a place in that record as more than a line on an invoice. An unexpected jump in token spend is frequently the first visible sign that something has gone wrong inside a session: an agent that has lost the thread will often loop through the same tool calls repeatedly, burning tokens on every pass without making progress. Treating cost as a correctness signal means a spike appears in debugging workflows the same way an error rate would appear in a conventional service.
The field has already converged on a shared vocabulary for most of this. The OpenTelemetry GenAI semantic conventions define attributes like gen_ai.system, gen_ai.request.model, gen_ai.usage.input_tokens, gen_ai.usage.output_tokens, and gen_ai.response.finish_reason for spans covering individual LLM calls, and gen_ai.operation.name (set to execute_tool), gen_ai.tool.name, and gen_ai.tool.call.id for spans covering tool calls. Two histogram metrics sit close to mandatory for any production agent deployment: gen_ai.client.operation.duration, which tracks latency in seconds, and gen_ai.client.token.usage, which tracks input and output tokens split by a gen_ai.token.type dimension. Without exporting both, there is no way to reason about what a session cost or how fast it ran after the fact.
One caveat belongs next to all of this. As of version 1.41 of the spec, every gen_ai. attribute still carries a Development stability badge. The only Stable attributes appearing in the same tables, error.type, server.address, and server.port, come from OpenTelemetry's core conventions rather than the gen_ai. namespace itself. Teams building on this vocabulary should treat it as a strong direction the industry has settled on, not a locked interface: attribute names can still shift without a major version bump.
MCP tracing extends this same model into territory that used to be opaque. Attributes like mcp.method.name, mcp.session.id, and mcp.protocol.version enrich the existing tool call spans rather than requiring a separate set of spans alongside them, so a tool call routed through MCP carries the same structure as any other.
One distinction in how these traces get built matters more than it might first appear. Some edges in a trace are recorded facts, like the tool call that produced a given diff. Others are inferred, like the conclusion that a downstream check failed because of that diff. A well-built tracing setup labels each edge according to which kind it is, and it never writes an inferred edge back into the trace as though it were a recorded one. Blur that line and the record stops working as evidence, becoming instead an argument the system is making about itself.
From captured record to debugging workflow via session replay
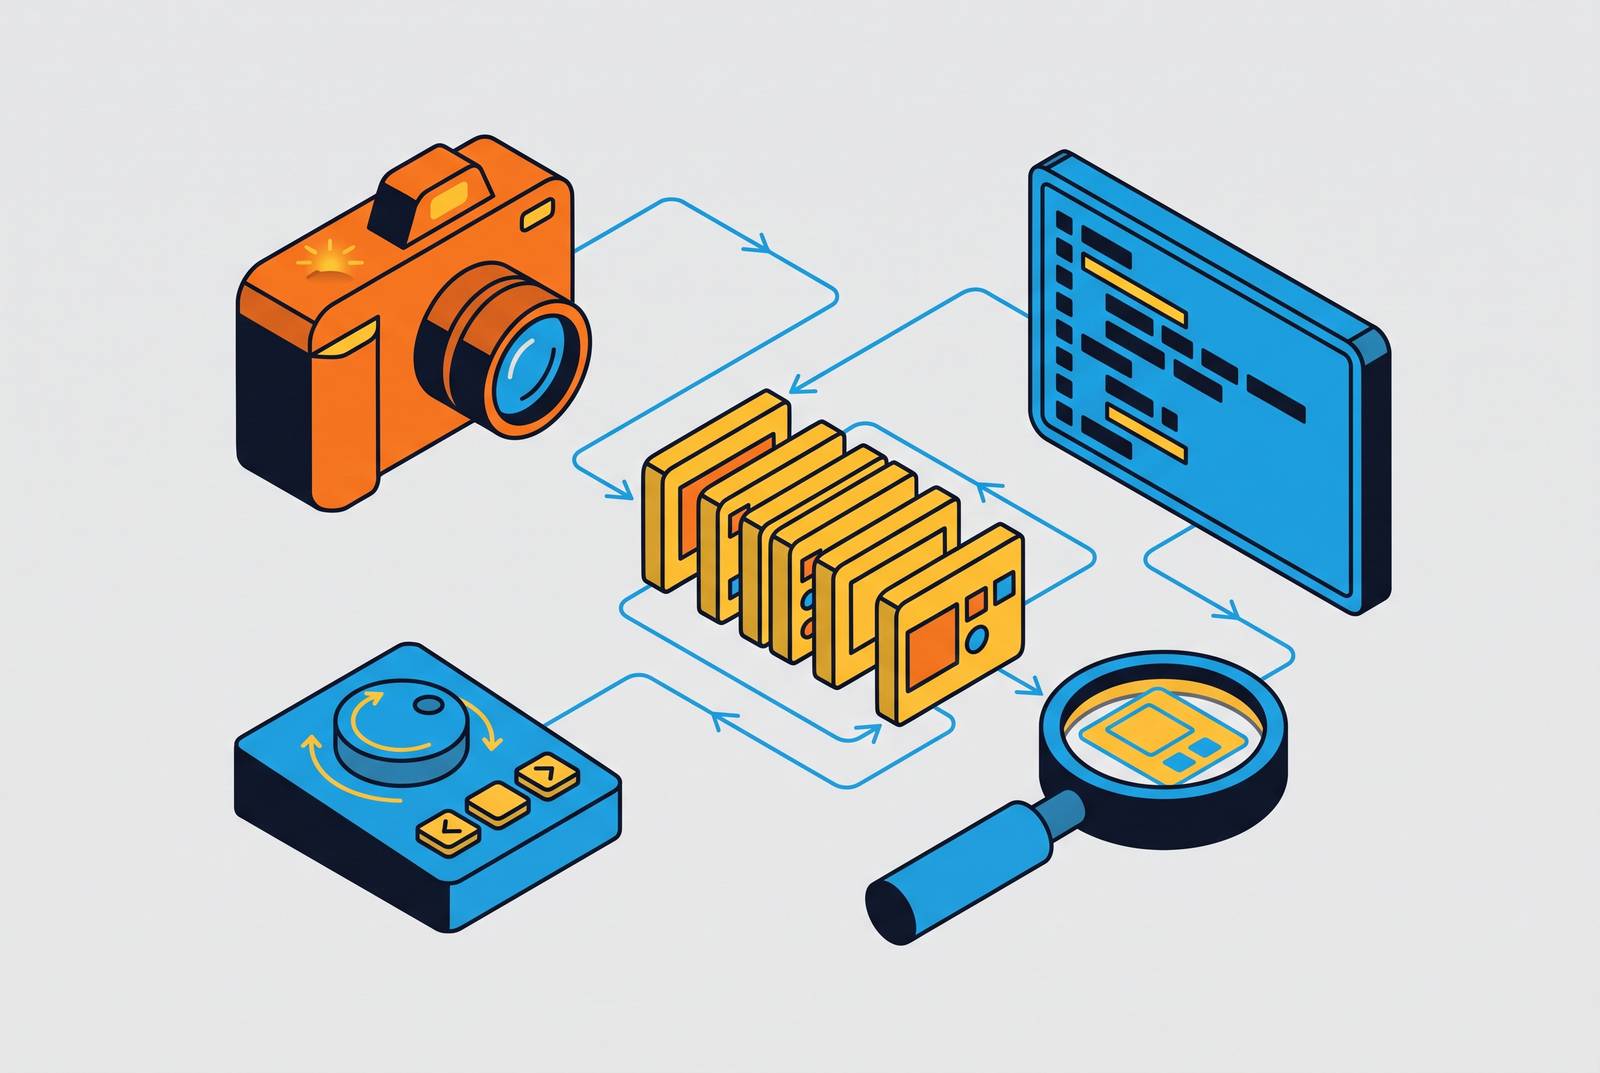
A captured trace only becomes useful once something turns it into a timeline a person can actually walk through, rather than a flat log a person has to read line by line. Replay reconstructs the full run as a connected sequence: every LLM call and tool invocation in order, the full prompt and completion at each step, the arguments and returned result for each tool call, per-step latency and token cost, and the exact point where something broke.
The practical shift is from inference to observation. Picture a session where the agent calls a search tool with a malformed query, gets an empty result set back, and then produces an answer anyway, one that reads as confident and is simply wrong. Reading through log lines, a developer has to piece that sequence together: a timestamp here, an error code there, a guess about what the model must have been thinking in between. A replay interface shows the chain directly: the malformed query, the empty response, and the hallucinated answer that followed, laid out as one continuous sequence.
Platforms built for this treat the trace as a navigable object. Braintrust captures complete traces as an expandable tree of nested spans, with each span showing its inputs, outputs, timing, cost, and any evaluation scores attached to it. Its underlying storage layer, Brainstore, was purpose-built for AI trace data, so it loads results notably faster than general-purpose databases handle the same workload, and that matters once a trace runs long enough to contain thousands of spans.
Checkpointing solves a related but distinct problem: what to do when a long session fails partway through. LangGraph's MemorySaver serializes and restores graph state, saving a checkpoint after every node execution, referred to as a super-step. When a session fails several hours into its run, a developer can restore from the last checkpoint and replay forward from that point with a modified configuration, rather than starting the entire session over from the beginning. Replay tells you what went wrong, and checkpointing lets you resume without paying for the hours of work that already succeeded.
Retention and storage architecture for sessions that run for hours
None of this capture and replay machinery helps if the record doesn't survive long enough for anyone to look at it. Tools like Jaeger and Zipkin were built around traces that complete in milliseconds to seconds, and their span storage, query performance, and retention policies all reflect that assumption. An agent trace can run for hours, and a tracing backend sized for millisecond spans will either choke on the volume or age the data out before a developer notices there's a problem worth investigating.
Tiered storage is the practical answer. Full trace data gets kept in hot storage for a short window, enough to support active debugging of recent sessions. Span summaries and key events move into warm storage for roughly a quarter, because that's long enough to support pattern detection across weeks of traffic. Session metadata and cost attribution stay in cold storage indefinitely, so compliance needs and long-run cost trending get covered without every raw span having to stick around forever. Getting this tiering wrong carries a real cost: enterprise teams running agents at scale can rack up storage and query bills that rival their inference spend if every span from every session sits in hot storage by default.
A handful of alert thresholds do most of the useful work once this storage is in place. Session cost running well above the median for similar sessions is worth investigating as a sign of a runaway loop. If a tool error rate spikes sharply within a short window, that usually points to a downstream service failure, not a problem with the agent's own logic. And an LLM finish_reason of "length" appearing too often across turns indicates that context window pressure is building, often before it causes an outright failure. These three signals turn a storage architecture into something that actively flags problems.
Turning a debugged session into a regression test case
Finding and fixing one bad session doesn't stop the same failure from shipping again; only turning that session into an automated test does. The execution record captured for debugging is also raw material for a regression suite, and treating it that way is what separates a team that fixes bugs from one that accumulates coverage against them.
Some platforms have built this conversion directly into the workflow. Braintrust can turn a production trace into an evaluation dataset with a single action, so a traced failure becomes a regression test case without requiring anyone to leave the platform, and CI/CD quality gates can then block a candidate change if it reproduces that same failure. LangSmith supports a similar path: it converts production traces into evaluation datasets from its own interface. For teams building this kind of production-to-test loop, what tends to matter most is whether failures can be curated into versioned datasets and replayed against new changes before those changes ship.
Spotting which failures are worth promoting into tests at all requires looking across more than one trace at a time. Braintrust's Topics classification surfaces recurring failure modes across all traffic by classifying patterns across many traces at once, since inspecting a single trace only tells a developer about that one failure. Finding which failures repeat, and where they concentrate, takes pattern detection run across the full corpus of sessions.
Put together, these pieces form a single feedback loop, not separate tools doing separate jobs. Session replay and cost tracking show you what's happening right now. Offline evaluation gates quality before a change goes out. A mature agent stack runs both, continuously, because replay without a path back into testing just piles up incidents that nobody stops from recurring.
Audit trail requirements for agent sessions, and the limits of tracing
A trace detailed enough to debug a session is not automatically detailed enough to satisfy a regulator, and the two kinds of record are built to answer different questions. A LangSmith trace documenting dozens of agent steps can help you track down a bug, but it does not by itself function as an audit trail, because standard application logging fails agents on three specific counts once auditability is the goal.
Those logs don't link the user's original intent back through the chain of sub-tasks and tool calls that followed from it. They record that an API was called, without capturing the reasoning the agent used to decide that call was the right one to make. And because agents frequently operate under a shared, generic service account, the logs often can't distinguish whether a given action came from the agent's own logic or from a human stepping in to override it.
The timeline for why this matters is no longer abstract. Under the EU AI Act, obligations for general-purpose AI models, including technical documentation and copyright requirements, took effect in August 2025. Broader transparency obligations under Article 50 apply starting August 2026. Full high-risk system requirements, including Article 14's human oversight provisions, conformity assessment, and registration, are now scheduled to apply from December 2027, after the Digital Omnibus on AI pushed that deadline back from its original August 2026 date. On February 17, 2026, NIST's Center for AI Standards and Innovation announced the launch of the AI Agent Standards Initiative, a federal standards effort that targets autonomous AI systems specifically, not AI models generally.
Compliance-grade infrastructure for agents is starting to look like compliance-grade infrastructure for anything else that handles sensitive operations. Daytona received a SOC 2 report on July 28, 2026 with an unqualified opinion, and offers HIPAA business associate agreements alongside a GDPR data processing agreement covering EU and UK requirements. That combination, an independently audited report plus the standard legal instruments regulated customers expect, is what compliance-grade certification for agent infrastructure looks like in practice, and you need more than a detailed trace sitting in a debugging tool to clear it.
How the agent's underlying platform shapes what can be captured and replayed
How much of this record is possible to capture depends on the infrastructure underneath the agent as much as on the instrumentation layered on top of it. If a platform treats credentials, sandboxing, and logging as core design decisions, its records turn out more complete and more trustworthy than anything added after the fact through SDK instrumentation alone.
A few capabilities only exist at the infrastructure level. Session-scoped credentials, minted fresh for a session and revoked once it ends, tie every tool call back to a specific session, even on infrastructure shared across many concurrent sessions. Isolated sandboxes keep diffs and file writes scoped to the session that produced them, instead of interleaved with the output of other concurrent sessions running on the same infrastructure. And logging every tool call, diff, and token at the platform level, before the agent's own SDK has a chance to drop or truncate anything, closes a gap that purely application-level instrumentation can't close on its own.
Running an agent locally doesn't automatically solve this, and in some ways it complicates it. Local agents give a team direct control over logging and where data lives, but even local inference through tools like Ollama can still send usage telemetry and session metadata off the machine unless you turn that behavior off. Local setups aren't private or complete by default; they just move the burden onto whoever configured the machine to make sure capture is happening.
When evaluating a sandbox for production agent workloads, three capture-relevant criteria matter most: whether state persists through idle periods without losing trace context, whether isolation happens at the kernel level so traces from one workload can't bleed into another, and whether the platform logs idle periods and the full lifetime of a credential, not just the moments when a tool call is actively running. Infrastructure built around those three properties produces a record worth trusting when a session finally needs to be replayed and understood.