Engineering Throughput Metrics When Coding Agents Share the Workload
Measure where AI-generated code stalls in your delivery pipeline, not just how fast it's written.
Engineering throughput metrics must track the software that gets delivered as well as the code that gets generated. Full observability for AI coding agent sessions needs tool-call logs, file diffs, token attribution, and a link from each session to its delivery outcome. With that evidence, engineering leaders can tell whether faster generation leads to better delivery and find where review, integration, and release hold it back.
Why feature-branch throughput rising while main-branch throughput falls is the defining pattern of agent-assisted teams
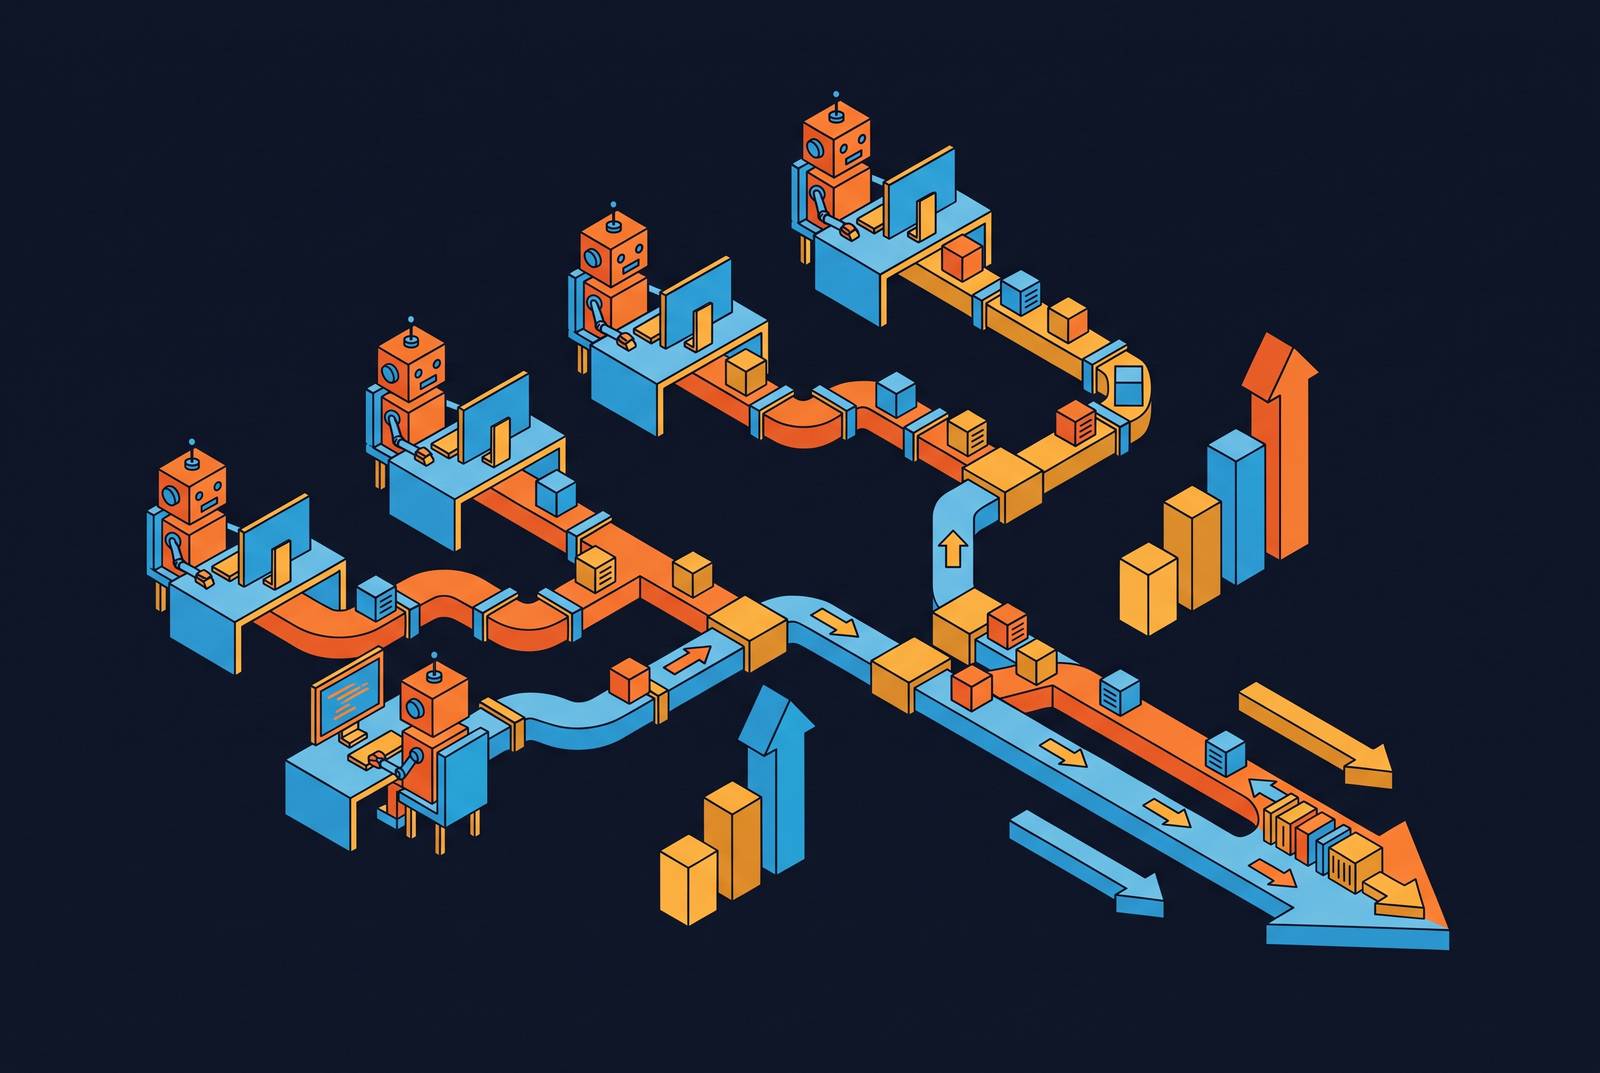
Feature-branch throughput can rise while main-branch throughput falls. That divergence is a concrete claim teams can test against their own pipeline data. It means more work is entering the delivery process without a corresponding increase in work passing its downstream gates. The distinction matters because a growing PR queue can look like progress even when less software reaches production.
LinearB's 2026 AI benchmarks, drawn from millions of pull requests across hundreds of engineering organizations, found that developers in the highest AI usage band more than doubled their merge rate. Yet the PR yield gap, between work entering the pipeline and work shipping cleanly, widened with it. A higher merge rate therefore does not establish that the whole delivery system improved. Nor does it contradict declining main-branch throughput, because the two signals describe different stages.
A structural mismatch arises as writing code accelerates faster than the human and organizational work needed to ship it. The defining pattern is the attenuation of generation gains as changes pass through review, integration, testing, and release.
How agents inflate the early pipeline stages while shifting bottlenecks downstream
Agents add more code faster than people gain the time to pay attention to it. Commits accumulate on branches, branches become PRs, and those PRs enter a review process whose capacity has not necessarily changed. LinearB's 2026 benchmark found that teams that used AI the most merged far more pull requests while median review time rose sharply. Much of the generation gain was absorbed at review, leaving a more modest organizational gain.
The delay begins before substantive review. LinearB's 2026 data found that agentic PRs wait significantly longer for a reviewer to pick them up, partly because they are larger and partly because ownership is ambiguous. An agent-opened PR that no engineer owns tends to sit unmerged. Once a reviewer engages, acceptance introduces another loss. LinearB's 2026 data puts acceptance of bot-authored code at 32.7%, compared with 84.4% for human-authored code, so more review effort goes into work that does not merge.
After review, integration, testing, and release can still hold work back. This asymmetry is particularly acute when agent activity has no governance limits. Platforms with session-level budget caps and full tool-call and diff logging, including Ellipsis, make the scope and cost of that activity visible at review time. Those records help identify which outputs are feeding congestion.
Why traditional throughput metrics fail to detect this shift — and what they measure instead
The problem with familiar throughput metrics is not that they measure nothing useful. Commits per week show how much coding took place, while PRs merged show how much work passed through a merge gate. Lines of code and branch count describe the volume and distribution of generated work. None of these establishes that a change reached production reliably or that its delivery justified the effort spent on it.
Agents weaken the link between those intermediate events and delivered value. A rising merge count can coexist with longer review cycles and a widening PR yield gap, as LinearB's 2026 data illustrates. A rising commit count can likewise describe more code awaiting assurance.
That distinction changes how the numbers should be interpreted. Adoption and weekly active usage indicate that agents are being used, but they do not establish delivery impact. When PR count or commit frequency becomes the target, the incentive is to produce more submissions rather than more changes that survive review and release. The measurement system then rewards the very activity that increases pressure on the constrained stages.
What a metric stack built for agent-assisted delivery actually needs to track
A useful metric stack follows work through the pipeline and preserves the distinction between inputs and outcomes. The first two describe exposure to AI assistance. The remaining dimensions show whether that exposure produces worthwhile delivery.
Complexity-adjusted throughput, or CAT, corrects one distortion at the PR stage. A wave of easy agent PRs therefore remains visible as easy work instead of appearing equivalent to a comparable count of difficult changes. CAT improves the interpretation of output, but it still needs downstream evidence of quality survival and release.
Production-Qualified Change, or PQC, supplies a stricter output unit by counting a change only after reliability gates are satisfied. Bhati's Verification Tax is the cost of the downstream review and assurance that agent-generated code needs. Together, these concepts distinguish qualifying output from the effort required to qualify it. PR cycle time from open to merge, split by AI-assisted versus human-authored work, shows where that effort accumulates.
Code quality as a throughput metric, not a separate concern
Quality belongs in the throughput stack because defective or short-lived code consumes delivery capacity. Rework, incidents, and additional review all draw on the attention that faster generation was supposed to free. Faros AI's Q2 2026 report found that high AI adoption correlates with substantially higher bugs per PR, substantially higher incidents per PR, and dramatically higher code churn. These correlations leave unresolved whether AI use caused each outcome, but they make quality essential to interpreting apparent throughput gains.
Code churn measures the percentage of code reverted, deleted, or substantially rewritten within a window. Comparing AI-assisted and human-only code over 30-day and 90-day windows shows whether generated output persists or returns as rework. Stanford's dataset of coding-agent interactions found that only roughly half of agent-produced code survived into user commits, with the remainder corrected, interrupted, or rejected.
Recovery time after a failed main-branch run extends this view into integration reliability. A change that leaves the main branch unable to pass its checks can consume time beyond its own review cycle. Innovation rate, the share of engineering work going to new features rather than maintenance and rework, captures the resulting allocation of capacity. It helps distinguish throughput gains that support new work from gains spent on remediation.
Cost per unit of delivered value as the metric that ties the stack together
Cost becomes meaningful when it has a delivery denominator. Total token spend shows how much was spent on tokens, while cost per merged PR or cost per production-qualified change shows how much was spent for each unit of output. LinearB's 2026 data frames PR yield as the delivery measure that makes cost per unit of value calculable. A lower generation cost is not necessarily an economic gain if more generated work fails downstream.
Agentic work consumes resources including context construction, repeated attempts, tool calls, sandbox minutes, CI minutes, security scans, reviewer attention, rework, and observability infrastructure. A provider billing dashboard leaves out some of those costs. Nominal task complexity is also an unreliable predictor of token use because agents can produce non-compiling attempts, revise passing solutions, or distrust provided tests. Cost reporting must therefore reach the session and task level.
Per-session spend tracking is especially useful when it can be joined to records of who or what triggered the resulting changes. With Ellipsis, spend visibility and attributable file-change logs provide evidence for that connection. The purpose is not to treat every expensive session as wasteful, but to relate its cost to the work that survives. That calculation depends on visibility inside the session.
How to get complete visibility into what an AI coding agent is doing at each step
Complete visibility requires session-level evidence. The minimum record connects tool calls and their success or failure, produced diffs, approvals and rejections, consumed tokens, and the final delivery outcome. Tool-call logs show what work was tried, while diffs show what changed. Token attribution connects resource use to that activity, and downstream outcomes show whether the activity delivered anything.
These records support different parts of the same metric stack. PR yield requires knowing what entered the pipeline and what shipped cleanly. Code survival needs a link between the generated changes and what was left after review and later changes. To work out cost per production-qualified change, teams need to link session costs to the output that qualified. Review load per agent session requires preserving the connection between the agent's work and the assurance it needed.
Jarmak's August 2026 monograph explains why that instrumentation must extend beyond the model. Apparent model failures can originate in harness design, execution state, retrieval, permissions, or resource allocation. Without evidence at those layers, a delivery shortfall can be attributed to the wrong cause. Outcome instrumentation also guards against proxy metric gaming, where measurable activity substitutes for task completion. A registry that uniquely identifies each agent and records its capabilities and permissions provides the attribution needed to compare delivery outcomes across agents and configurations.
How agent configuration as code makes the metric stack auditable and improvable
Observability explains what happened, but improvement also requires a record of the configuration that produced it. Agent definitions must therefore be engineering artifacts that teams can review and version as part of the delivery process. Version-controlled configuration makes a spike in churn, a drop in PR yield, or a cost overrun traceable to a specific change. It gives teams a place to start looking into what went wrong before they assume that model behavior or human error caused it.
Budget enforcement belongs in that same configuration. Session, developer, and time-period caps, defined in the YAML file that specifies the prompt and tools, place explicit limits on spending. Those limits cap the spending used to work out cost-per-delivery, though the cost for each unit still depends on how much gets delivered. Keeping prompts, tools, and budgets together makes the operating conditions available for review.
Ellipsis implements this pattern through YAML agent definitions checked into repositories. Its agents run in isolated cloud sandboxes with per-session credentials minted and revoked on completion, while every tool call, file change, and turn is logged and attributable to a person or trigger. In this pattern, configuration history and session records serve complementary roles. The former identifies the intended operating conditions, while the latter records the activity whose delivery results are being measured.
How to read the metric stack as a delivery signal rather than a performance report
The first diagnostic step is to baseline merge rate against the team's own output from a year ago, split by AI usage intensity, as LinearB's 2026 benchmarks recommend. This establishes whether the throughput gap is widening or closing before agent configuration or review processes change. The comparison is a pipeline baseline. Its purpose is to find where additional generation stops translating into additional delivery.
Reading the stack then means comparing survival and review demand. If output rises while yield falls, the next task is to trace the loss through session activity, review, and integration. LinearB's data shows that AI code review does more than any other single change to lift PR yield and has the widest gap between leading and median organizations. Its value should be judged by that downstream yield rather than by the volume of automated review activity.
The ongoing discipline is to measure PR yield and code survival rate weekly, trace degradation to specific version-controlled agent configurations, adjust those configurations, and measure again. Each adjustment then has a delivery outcome against which it can be judged.